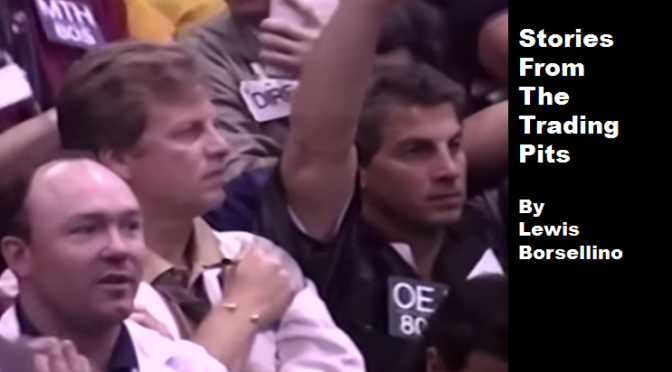
PIT STORIES by Lewis Borsellino, is a collection of real-life experiences from the height of the CME trading-pits, during the time when the pit traders ruled the marketplace and directly managed orders from such customers as Merrill Lynch, Goldman Sachs, Bear Stearns, E.F. Hutton. Lewis Borsellino accounted for 10 percent of the average trading volume in the S&P contract, just for himself. Known as one of the “biggest and best” traders in S&P futures, these stories are being re-told exactly as they happened. *Disclaimer, if you are sensitive to language, this post isn’t for you.
It was a slow trading day and I was standing in the S&P 500 pit, not particularly busy. Mark, a phone clerk who worked for RB&H clearing firm popped his head into the pit and tapped me on the shoulder. I could sense he was nervous and hesitant to distract me from trading, but having known him for years, I knew if it wasn’t important, he wouldn’t bother me.
Mark: Hey Lew, you have a phone call at the desk.
Lewis: Is something wrong?
Mark signaled to come out of the pit so we could talk in private. I ducked under the top step trading post and walked out of the pit towards Mark.
Lewis: What’s up?
Mark: There is a detective from the Chicago police on the phone, he has called twice. The first time you weren’t in the pit and I told him I didn’t see you.
Lewis: Chicago police? I wonder what the fuck this is about. Did he say?
Mark: No but he said he was going to keep calling until he talks to you.
Lewis: Fuck it, is he on the phone now?
Mark: yes
I walked over the RB&H trading booth and picked up the phone… hello…
The cop had the typical Chicago south-side Irish accent, a combination of detective and tough guy attitude.
Detective McMahon: Is this Mr. Lewis Borsellino?
Lewis: Yes, how can I help you?
Detective McMahon: This is detective John McMahon with the Chicago Police Area 1 Financial Crimes Division. Do you mind if I ask you a few questions?
Lewis: Sure, go ahead.
Detective McMahon: Mr. Borsellino, have you been in a terrible car accident in the last year?
Lewis: No I haven’t been in a car accident since prom, my senior year, 20 years ago.
Detective McMahon: Were you in the hospital more importantly, did you have a head trauma which caused you to be in a coma?
Lewis: No, no head trauma, no hospital, no coma.
Detective McMahon: Do you have a trading relationship with a company named Short Term capital management out of Tampa Bay Florida?
Lewis: That doesn’t ring a bell.
Detective McMahon: How about a gentleman by the name, Mark Thorsen? Do you know him?
Lewis: No, I never heard of the guy, Detective should I get an attorney? How many more questions do you have?
Detective McMahon: No, you’re ok, look do me a favor and call detective Charlie Stone at the Tampa Bay Police department, let me give you his number.
Lewis: Hold on, let me get a pen. (I put the phone on my shoulder to take out a trading card and prepared to write the number down.) Go ahead; I’m ready… what’s the number?
Detective McMahon: 555-555-5555 Detective Charlie Stone, Tampa Bay police, he’s waiting for your call.
Lewis: Ok, I got it, thanks.
Detective McMahon: No problem, thank you.
I hung up the phone and looked at Mark.
Mark: Everything OK?
Lewis: Yes, he wanted to know if I was in a car accident and in a coma for the last year.
Mark: Wow, that’s fuckin’ weird!!
Lewis: The way I have been trading lately, I wish I was in a fuckin’ coma. At least I wouldn’t be losing money!!!
Mark: The market has been so slow we aren’t doing any business, more and more on the fuckin’ e-mini machine. I will be looking for a new job soon.
Lewis: So will I! Let me call this guy and see what’s up.
Mark dialed the phone and stepped aside so I could sit at the desk and talk privately…
Voice on phone: Hello Detective Stone speaking.
Lewis: Detective Stone, this is Lewis Borsellino calling from Chicago. What can I do for you?
Detective Stone: Mr. Borsellino, thank you for calling, would you mind if I ask you a few questions?
Lewis: No, go ahead…
Detective Stone: (Starts with the same line of questioning as the Chicago police) Mr. Borsellino, have you been in a car accident and suffered trauma to your head which caused you to be in a coma for the last six months?
Lewis: I told the Chicago Detective no. No accident. No coma!
Detective Stone: I am sorry; I have just a few more questions…
Lewis: OK
Detective Stone: Do you know a Mark Thorsen who runs a trading company named Short Term Capital Management:
Lewis: No. Like I told the Chicago police the company and the owners name does not ring a bell. What do they trade? Stocks or commodities?
Detective Stone: I am not sure, could be both, but I am not sure.
Lewis: Well all I trade are stock futures not individual stocks.
Detective Stone: Ok Mr. Borsellino. You wrote a book: The Day Trader from the Pit to the PC?
Lewis: Yes, I wrote that book.
Detective Stone: Do you know how Mark Thorsen would have a signed copy of your book addressed to him?
Lewis: Addressed to him? What do you mean by that? Like I mailed it to him?
Detective Stone: No no, inside the cover, you signed the book… hold on, let me read what it says…( I can hear tussling of the papers…) Mr. Borsellino, can you hear me?
Lewis: yes, I can hear you detective.
Detective Stone: Ok, it reads the following… Mark, Good Luck with your trading, nice meeting you. Best wishes, Lewis Borsellino
Lewis: Detective, how do you know if I signed the book? Not to be difficult but that book sold 75 thousand copies! Anyone could have signed that book.
Detective Stone: Yes, of course you’re right but we have to check out his story.
Lewis: Detective let’s assume I did sign the book, in the last 5 years I have been to 50 trade shows. Seriously I could have signed a thousand books with the same sort of wording. I have no idea who this guy is.
Detective Stone: That’s what we figured but we have to check out all the leads!!!
Lewis: Can you tell me what is going on? Maybe I can help you.
Detective Stone: Apparently, Mark Thorsen started a company called Short Term Capital Management. He was showing your book to potential investors and implying you were the trader and he and you were partners.
Lewis: You’re kidding! I don’t remember this guy… how much money did he raise?
Detective Stone: It appears to be like $600,000.
Lewis: Wow! $600,000!!! Can I ask you a question?
Detective Stone: Sure
Lewis: Why are you asking me about being in a car accident and a coma?
Detective Stone: Oh well, several of the investors started asking for their money back. He said he goes to Chicago once a month to meet with you but six months ago you had a bad car accident and you’re in a coma and all the accounts are frozen.
Lewis: You have to be kidding me! That’s telling me all the money’s gone! He either lost it or spent it!!!
Detective Stone: I think you’re correct. We’ve been tracing the money… looks like he bought a new boat, a new car and at least $50,000 went to the strip clubs!!!
Lewis: That’s terrible! Well I definitely don’t know this guy. I hope I helped you!
Detective Stone: Mr. Borsellino, you were a big help, thanks for calling me! Sorry to have bothered you.
Lewis: No problem, if you need me, you know where to find me!
Detective Stone: I don’t think we need to talk to you anymore! Bye.
Lewis: Bye.